Showing 749 items matching "chart"
-
 Moorabbin Air Museum
Map (item) - Commonwealth of Australia Visual Charts, VEC (various), Terminal Chart (Various)
-
 Moorabbin Air Museum
Plan (item) - Bristol Aeroplane 170 schematic drawings, Fuse Chart Mk XXI
Bristol Aeroplane Company Ltd -
Moorabbin Air Museum
Plan (item) - Bristol Aeroplane 170 schematic drawings, Circuit Ident Chart - Basic
Bristol Aeroplane Company Ltd -
Moorabbin Air Museum
Document (item) - CAC Collection - Copy Of Bendix Products Division Instruction Chart No.1100
-
Moorabbin Air Museum
Document (item) - CAC Commonwealth Aircraft Corporation Organisational Charts, Organisational Chart
Commonwealth Aircraft Corporation -
Clunes Museum
Poster - Advertising Chart, Thomas Brigg Ltd, Bigg's Sheep Chart, Unknown
Coloured poster with metal edges top and bottom outlining parasites and growth patters of sheep. Included in body of poster are advertisements for sheep dip and control applications of preventative measures.A.B.C. Code 5th Edition printed on postersheep, stock management, sheep dip -
University of Melbourne, Burnley Campus Archives
Document, Resuscitation flow chart, c. 1980
Instructions for resuscitation of unconscious victimfirst aid, emergency -
Whitehorse Historical Society Inc.
Document - Family Tree, Pedigree chart, 1/06/1993 12:00:00 AM
Family group records of Fisher family 1806 to 1890.Family group records of Fisher family 1806 to 1890.Family group records of Fisher family 1806 to 1890.fisher, james cowley morgan, fisher family, kefford family -
 Ballarat Heritage Services
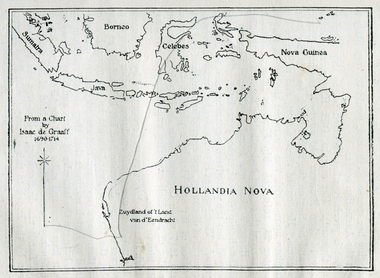
Photograph - Map, Map of New Holland from a chart by Isaac de Graaf (1690-1714), c1714
Copy of a map from 'A Short HIstory of Australia' by Ernest Scott.map, new holland, hollandia nova, isaac de graaff, new guinea, australia of the holy spirit, papua, new hebrides, new zealand, nuyts land, van dieman's land, tasman's track -
 Ballarat Heritage Services
Photograph - Map, Portion of Captain James Cook's Chart of New South Wales, 1770, 1770
Copy of a map from 'A Short HIstory of Australia' by Ernest Scott.map, explorers, exploration, voyages, captain james cook, new south wales coast -
 Department of Health and Human Services
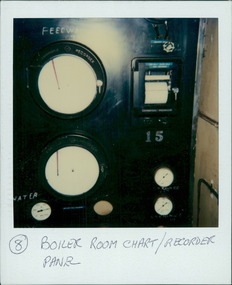
Photograph, Photo of an analogue temperature chart recording panel used in the boiler room at Caloola Training Centre Sunbury
Colour Photo -
 Ringwood RSL Sub-Branch
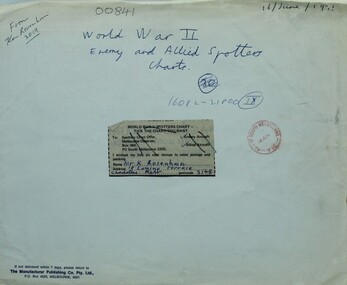
Document, Aircraft recognition chart
40 photographs of both allied and enemy aircraft -
Moorabbin Air Museum
Pamphlet (Item) - Atmosphere Chart ...... Speed Temperature Graph By AiResearch, Atmosphere Chart ...... Speed Temperature Graph
-
Moorabbin Air Museum
Document (Item) - Ansett Organization Chart 1966
-
Moorabbin Air Museum
Document (Item) - Ansett - Organisational Chart
-
Moorabbin Air Museum
Drawing (Item) - Routing charts, Routing Chart for AG & D supplies for Radio Crates ( title very faint so this may not be totally accurate)
Unsure -
Moorabbin Air Museum
Manual (Item) - Dakota Electrical Power Load Chart & TACAN & wiring diagrams
-
Moorabbin Air Museum
Drawing (Item) - Boston III A , Drawing Lubrication Chart Drawing No. A3590
-
Moorabbin Air Museum
Map (Item) - Visual Terminal Chart - Melbourne<>Adelaide
-
Moorabbin Air Museum
Drawing (Item) - Allison High Pressure Fuel Filter Series Operation Chart No 5F-3
-
Moorabbin Air Museum
Map (Item) - Department of the Navy Hydrographic Office Air Navigation Chart No V30-57 South Pacific Ocean Australia and North East Seas and Islands
-
Moorabbin Air Museum
Equipment - Kevin Kerle Collection, Tin of Circuit Breakers, Servo Accelerometer, Plastic Box of Turner Bank Bubble Indicators, Plastic Container of Resistors, Tail of Plastic Bomb, Ball Bearing, Artificial Horizon x2, Sealed Gyroscope x2, Sealed Attitude Gyroscope , Compass Ball, Artificial Horizon Ball, Pitot Tube Static Probe, Minature Transmitter, Cable Pulleys, Bank Indicator, Static Probes, Warning Indicator Lights, Wind Range Chart, Nach Number Computer, Engine Tags, Paint Samples, F111 Electronic Parts, Ikara Wing Cross Section
-
Moorabbin Air Museum
Document (Item) - Japanese Army Air Force Code Designations - Army Airplane Designation Chart (K1) Airplanes Up To Present Time
-
Moorabbin Air Museum
Document (Item) - Figures Depicting the Organisational Structure of CAC Management, 1973-1977, Commonwealth Aircraft Corporation Pty. Ltd. Organisation Chart
-
 Charlton RSL Sub Branch
Article - Ration scale chart, Post WW2 daily ration scale chart in 2 parts
2 pages listing daily rations for Australian Militia and weekly totalsSothern command area. Authority AHQ. Memo 30281 of 20 Aug 1947. (Hand written -Capt. Crawford) -
 Melbourne Tram Museum
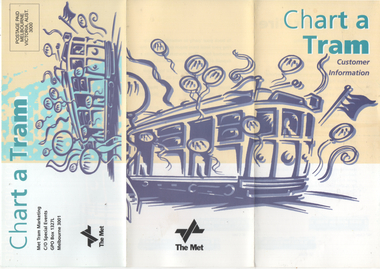
Pamphlet, Met Tram, "Chart a Tram - Customer information", c1995
Pamphlet produced by Met Tram Marketing about the hiring of trams - gives rates, seating capacity, depots and tram types. Has a list of depots and the contact details. Not dated, c1995. Has an enquiry form attached.Yields information about hiring a tram c1995.Pamphlet, 3 fold DLfull colour.met tram, tramways, tram hire, charters -
 Ambulance Victoria Museum
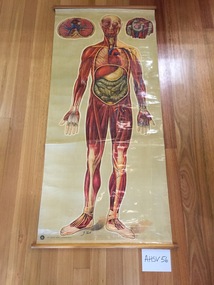
Chart, medical, human body, muscles and organs
Rectangular medical chart showing the human body, muscles and organs.The chart is made from coated and printed paper on a fabric (?cotton) backing and is attached with metal tacks to timber batons at each end . A strip of red cotton tape is attached to the mid-part of the upper baton and has been used to secure the chart when it is rolled up. Metal ring eyelets are screwed into either end of the upper baton and were probably used to assist when hanging the chart.The artists name 'J.Teck' is included on the lower edge on the front of the chart. The logo of the St John's Ambulance Association and the words 'ST JOHN'S GATE, LONDON E.C. 1' are printed on the lower edge of the chart (left hand side on the front of the chart). The words 'FULL BODY INC LIMBS' is written in black texter pen on the upper baton. The words 'ORGANS, MUSCLES' have been written on the top margin of the chart on the reverse side.medical chart, human body, j.teck -
 Ambulance Victoria Museum
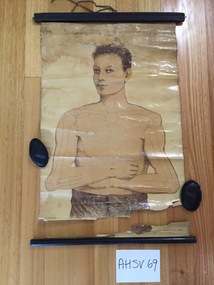
Chart, medical, human body, Ruddiman, Johnston & CO., Ltd
Rectangular chart made from printed and coated paper on a fabric base. The chart shows the upper torso of a human male. The chart is mounted at either end on timber batons using small metal tacks. Masking tape has been placed over the metal tacks in an attempt to repair the chart. The upper baton is moulded, while the lower baton is circular in cross-section. Both batons are stained black.Two screwed metal eyelets have been attached at either end of the upper baton for use in hanging the chart. A short length of brown/white cotton tape is attached to the mid-point of the upper baton with a metal tack. the tape is used to secure the chart after it has been rolled up.Printed on the RHS front face of the chart at bottom edge are the words 'All rights reserved'. Printed on the LHS front face of the chart at bottom edge are the words 'RUDDIMAN, JOHNSTON & CO., Ltd., LONDON'ruddiman johnston & co, medical chart -
 Flagstaff Hill Maritime Museum and Village
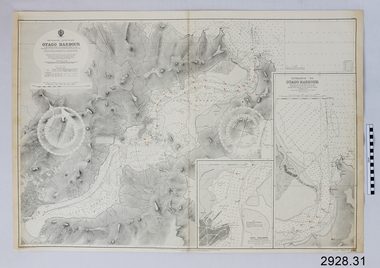
Document - Navigation Chart, British Admiralty, Otago Harbour, Late 19th to Early 20th century
Navigation charts are used by mariners around the world for navigating waterways. This chart was created for Otago Harbour in New Zealand. A ship "Otago' was named after this harbour and was once commanded by renowned maritime author Joseph Conrad. That ship now lies in Otago Bay, in the Derwent River, Tasmania.This navigation chart was published by the British Admiralty cartographer, to aid mariners to navigate the world's water bodies. Navigation charts are still used today, along with other navigational instruments.British Admiralty Navigation Chart - Otago Harbour, South Island, New Zealand. Chart shows insets with finer detail of important sections.warrnambool, shipwrecked-coast, flagstaff-hill, flagstaff-hill-maritime-museum, maritime-museum, shipwreck-coast, flagstaff-hill-maritime-village, shipwrecked-artefact, british admiralty navigation chart, navigation chart, british admiralty, otago harbour, south island, new zealand, otago bay, derwent river, tasmania, joseph conrad -
 Ballarat Tramway Museum
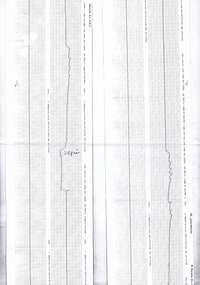
Document - Charts, Public Transport Corporation Victoria (PTC), 671 Brake testing charts, 20/02/1996 12:00:00 AM
Demonstrates how tramcar braking performance could be measured mid 1990's.Original chart outputs of brake testing carried out by Met Tram (Mal Ashworth & Les Jeans) on tram 671 on 20/2/1996 - following installation of composite brake shoes. From a machine set up to measure de acceleration. 275.1 - Test results for 25psi and 39 psi application - driver WAD - 125H x 820 long 275.2 - test results for full service application - 125H x 600 long. Photocopy of charts made at the time. Images of charts added 22/10/2013 See Fares Please! March 1996various notes regarding pressures etc. on chart.tramways, trams, w4 class, brake charts, testing, tramcar brakes