
Showing 4 items matching "the mercator chart"
-
 Moorabbin Air Museum
Book - Air Navigation, The Essentials of Air Navigation
... ...The Mercator chart...Air navigation Definitions The triangle PZX The sextant The Mercator chart The compass Wind Reduction of sights Celestial bodies On accuracy Pressure/barometer/altimeter Energy/Bernoulli's theorem/airspeed indicator Heat Lapse rates/humidity/stability Vertical movements of air/ cloud. ...Overview of astronomical navigation for all aviation purposes, circa 1942non-fictionOverview of astronomical navigation for all aviation purposes, circa 1942definitions, the triangle pzx, the sextant, the mercator chart, the compass, wind, reduction of sights, celestial bodies, on accuracy, pressure/barometer/altimeter, energy/bernoulli's theorem/airspeed indicator, heat, lapse rates/humidity/stability, vertical movements of air/ cloud., winds, depressions and highs, dynamics of flight, maps & charts -
 Bendigo Military Museum
Map - RASvy " Map Makers Exhibition 2025 "- Map display, RAN Hydrographic Office, 1972 - 1992
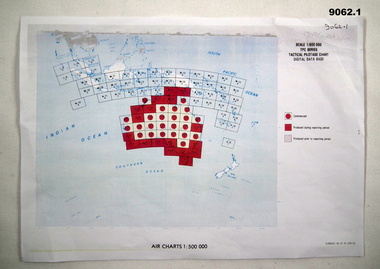
... Of Particular note these charts were used to plot "Rhumb Lines or loxodromes" where a course crosses all Meridians (Lines of latitude and longitude) at the same angle. On Mercator...Of Particular note these charts were used to plot "Rhumb Lines or loxodromes" where a course crosses all Meridians (Lines of latitude and longitude) at the same angle. On Mercator ...All of these Charts / Maps were used for the RSL Museum display " The Mapmakers " ( of RASvy. ) 10 Jun - 10 Aug 2025. .1 Catalogue of Tactical Pilotage Charts, 1:500 000 Scale. Digital Data Base available as at 30Jun 92. This catalogue page shows the extent of the Australian area of responsibility for aeronautical charting. .2 RAAF PLOTTING CHART. NP 22-2 (Navigational Plotting) Tasmania. MERCATOR PROJECTION. This series of charts were used for the training of RAAF Navigators. These charts were produced and printed at the Army Survey Regiment, Bendigo. .3 RAAF PLOTTING CHART AUSTRALIA - SOUTHEAST. NP 27 is Based on LAMBERT CONFORMAL CONIC PROJECTION. This series of charts was used by RAAF Navigators for the planning of RAAF flights. These charts were produced and printed at the Army Survey Regiment, Bendigo. .4 RAAF LONG RANGE PLOTTING CHART. NP 43-4 AUSTRALIA WESTERN. MERCATOR PROJECTION. This series of maps were used for the planning of RAAF flights. Of Particular note these charts were used to plot "Rhumb Lines or loxodromes" where a course crosses all Meridians (Lines of latitude and longitude) at the same angle. On Mercator projection charts Rhumb lines are conveniently shown as straight lines and are also lines of constant compass bearing. Rhumb lines are usually longer than the shortest distance between two points. The shortest distance between two points on the earth's surface is called a "Great Circle Route" which is a route on a circular path on the surface of the earth where the centre of that circle is also the centre of the earth. Great Circle Routes on a Mercator Projection are however curves and harder to plot. These charts were produced and printed at the Army Survey Regiment, Bendigo. .5 RAAF LONG RANGE PLOTTING CHART. NP 43-7 SOLOMON ISLANDS. MERCATOR PROJECTION. Used for the planning of RAAF flights. .6 RAAF AIR STAFF PLANNING CHART NS 137-1 DARWIN NORTH WEST. AZIMUTHAL EQUIDISTANT PROJECTION. This series of charts were used for planning by the staff. The whole chart was produced by joining the four quadrant maps together. The charts are based on a single point of tangency (in this case Darwin) and shows radius (distance) in nautical miles to and from that point. A series of charts were produced centred on each of the major airfields in Northern Australia. These charts were produced and printed at the Army Survey Regiment, Bendigo. .7 RAAF AIR STAFF PLANNING CHART NS 137-2 DARWIN NORTH EAST. AZIMUTHAL EQUIDISTANT PROJECTION. Used for the planning by the staff. The charts are based on a point of tangency and show radius in nautical miles. .8 RAAF AIR STAFF PLANNING CHART NS 137-4 DARWIN SOUTH WEST. AZIMUTHAL EQUIDISTANT PROJECTION. Used for the planning by the staff. The charts are based on a point of tangency and show radius in nautical miles. .9 RAAF AIR STAFF PLANNING CHART NS 137-3 DARWIN SOUTH EAST. AZIMUTHAL EQUIDISTANT PROJECTION. Used for the planning by the staff. The charts are based on a point of tangency and show radius in nautical miles. .10 TACTICAL PILOTAGE CHART. TPC R-13B. LAMBERT CONFORMAL PROJECTION. Used by pilots for flight planning and could be used in flight if necessary for visual navigation using major ground features shown on the chart. These charts also contained aeronautical information such as airfields, radio navigation beacons and obstructions. Contours and height information was shown in feet to be compatible with aircraft altimeters. Each graticule square also contained a Maximum Safe Elevation Figure (MEF) also in feet. Coverage of this series over Australia's area of interest were produced and printed at the Army Survey Regiment, Bendigo. .11 HYDROGRAPHIC CHART. AUS 158. PORT PHILLIP SOUTH and WEST CHANNELS. PROJECTION TRANSVERSE MERCATOR. Used by all people needing to navigate a vessel. Hydrographic charts were printed at the Army Survey Regiment, Bendigo. .12 HYDROGRAPHIC CHART. AUS 157. GEELONG HARBOUR and APPROACHES. PROJECTION TRANSVERSE MERCATOR. Used by all people needing to navigate a vessel. .13 EN ROUTE CHART. AUSTRALIA ERC HIGH. H1 and H2. LAMBERT CONFORMAL CONIC PROJECTION. This series of charts were regularly produced by the RAAF Aeronautical Information Service (AIS) and contained current aeronautical information for pilots. These charts were printed at the Army Survey Regiment, Bendigo..1 Tactical Pilotage Chart Series Catalogue. Current as at 30 Jun 92. .2 Extract of Navigational Plotting Chart " NP22-2 Tasmania " .3 Extract of Navigational Plotting Chart " NP 27 RAAF PLOTTING CHART AUSTRALIA - SOUTHEAST " .4 Extract of Navigational Plotting Chart " RAAF LONG RANGE PLOTTING CHART NP43-4 AUSTRALIA WESTERN " .5 Extract of Navigational Plotting Chart " RAAF LONG RANGE PLOTTING CHART NP43-7 SOLOMON ISLANDS " .6 Extract of Navigational Series " RAAF AIR STAFF PLANNING CHART NS 137-2 DARWIN NORTH WEST " .7 Extract of Navigational Series " RAAF AIR STAFF PLANNING CHART NS 137-1 DARWIN NORTH EAST " .8 Extract of Navigational Series " RAAF AIR STAFF PLANNING CHART NS 137-4 DARWIN SOUTH WEST " .9 Extract of Navigational Series " RAAF AIR STAFF PLANNING CHART NS 137-3 DARWIN SOUTH EAST " .10 Extract of Tactical Pilotage Chart " TPC R-13B " .11 Extract of Hydrographic Chart " PORT PHILLIP SOUTH and WEST CHANNELS " .12 Extract of Hydrographic Chart " GEELONG HARBOUR and APPROACHES " .13 Extract of En Route Chart " AUSTRALIA ERC HIGH " " H1 and H2 " royal australian survey corps, rasvy, fortuna, detachment - army survey regiment, army svy regt, asr -
 Flagstaff Hill Maritime Museum and Village
Planisphere, Early 20th Century
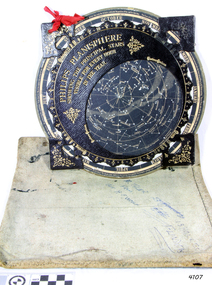
... Mercator described his 1569 world map as a Planisphere. The word describes the representation of the star-filled celestial sphere on the plane. The first star chart...Mercator described his 1569 world map as a Planisphere. The word describes the representation of the star-filled celestial sphere on the plane. The first star chart ...The word Planisphere (Latin planisphaerium) was originally used in the second century by Claudius Ptolemy to describe the representation of a spherical Earth by a map drawn in the plane. This usage continued into the Renaissance: for example Gerardus Mercator described his 1569 world map as a Planisphere. The word describes the representation of the star-filled celestial sphere on the plane. The first star chart to have the name "Planisphere" was made in 1624 by Jacob Bartsch. Bartsch was the son-in-law of Johannes Kepler, discoverer of Kepler's laws of planetary motion. A significant item of celestial mapping used by marine navigators This particular item was made and used in the first quarter to half of the 20th centuryPlanisphere of northern hemisphere, with canvas bag. Planisphere consists of a circular star chart attached at its centre to an opaque circular overlay that has a clear elliptical window or hole so that only a portion of the sky map will be visible in the window or hole area at any given time. The chart and overlay are mounted so that they are free to rotate about a common pivot point at their centres. The star chart contains the brightest stars, constellations and (possibly) deep-sky objects visible from a particular latitude on Earth. The night sky that one sees from the Earth depends on whether the observer is in the northern or southern hemispheres and the latitude. A Planisphere window is designed for a particular latitude and will be accurate enough for a certain band either side of that. Planisphere makers will usually offer them in a number of versions for different latitudes. Planispheres only show the stars visible from the observer's latitude; stars below the horizon are not included. A complete twenty-four-hour time cycle is marked on the rim of the overlay. A full twelve months of calendar dates are marked on the rim of the starchart. The window is marked to show the direction of the eastern and western horizons. The disc and overlay are adjusted so that the observer's local time of day on the overlay corresponds to that day's date on the star chart disc. The portion of the star chart visible in the window then represents (with a distortion because it is a flat surface representing a spherical volume) the distribution of stars in the sky at that moment for the Planispheres designed location. Users hold the Planisphere above their head with the eastern and western horizons correctly aligned to match the chart to actual star positions. "Made in Germany for GEORGE PHILIP & SONS Ltd. Geographical and Educational Depot, 32 Fleet Street, London" Canvas bag has "Capt. H (Howard) Tyler from Captain H. F. Woolf" "Tyler 22 ? St East Brighton" also "13 Halls St Flinders"flagstaff hill, warrnambool, shipwrecked-coast, flagstaff-hill, flagstaff-hill-maritime-museum, maritime-museum, shipwreck-coast, flagstaff-hill-maritime-village, planisphere, star map, marine navigation, maps, george philip & sons -
 Flagstaff Hill Maritime Museum and Village
Planisphere, Early 20th Century
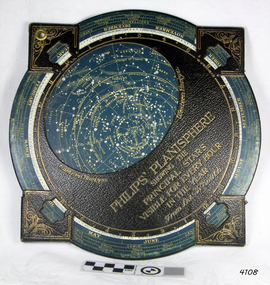
... Mercator described his 1569 world map as a Planisphere. The word describes the representation of the star-filled celestial sphere on the plane. The first star chart...Mercator described his 1569 world map as a Planisphere. The word describes the representation of the star-filled celestial sphere on the plane. The first star chart ...The word Planisphere (Latin planisphaerium) was originally used in the second century by Claudius Ptolemy to describe the representation of a spherical Earth by a map drawn in the plane. This usage continued into the Renaissance: for example Gerardus Mercator described his 1569 world map as a Planisphere. The word describes the representation of the star-filled celestial sphere on the plane. The first star chart to have the name "Planisphere" was made in 1624 by Jacob Bartsch. Bartsch was the son-in-law of Johannes Kepler, discoverer of Kepler's laws of planetary motionA significant item of celestial mapping used by marine navigators This particular item was made and used in the first quarter to half of the 20th century.Planisphere consists of a circular star chart attached at its centre to an opaque circular overlay that has a clear elliptical window or hole so that only a portion of the sky map will be visible in the window or hole area at any given time. The chart and overlay are mounted so that they are free to rotate about a common pivot point at their centers. The star chart contains the brightest stars, constellations and (possibly) deep-sky objects visible from a particular latitude on Earth. The night sky that one sees from the Earth depends on whether the observer is in the northern or southern hemispheres and the latitude. A Planisphere window is designed for a particular latitude and will be accurate enough for a certain band either side of that. Planisphere makers will usually offer them in a number of versions for different latitudes. Planispheres only show the stars visible from the observer's latitude; stars below the horizon are not included. A complete twenty-four-hour time cycle is marked on the rim of the overlay. A full twelve months of calendar dates are marked on the rim of the star chart. The window is marked to show the direction of the eastern and western horizons. The disc and overlay are adjusted so that the observer's local time of day on the overlay corresponds to that day's date on the star chart disc. The portion of the star chart visible in the window then represents (with a distortion because it is a flat surface representing a spherical volume) the distribution of stars in the sky at that moment for the Planispheres designed location. Users hold the Planisphere above their head with the eastern and western horizons correctly aligned to match the chart to actual star positions. "Sold by J DONNE & SON, Booksellers & Stationers, 349 Post Office Place Melbourne 349. Admiralty Chart Agents" and " Made in Germany for George Philip & Son Ltd" England . Signature "Capt E. B. ?..id, 22 Baund St"flagstaff hill, warrnambool, shipwrecked-coast, flagstaff-hill, flagstaff-hill-maritime-museum, maritime-museum, shipwreck-coast, flagstaff-hill-maritime-village, star map, marine navigation, maps, george philip & sons
