Physical description
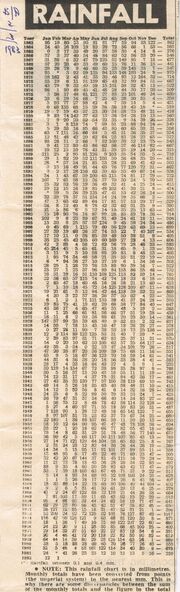
Rainfall Chart; Bendigo Advertiser 2/3/1983. Chart shows rainfall from 1863 to1983. It is noted at the bottom that the rainfall chart is in millimetres. Monthly totals have been converted from points (the imperial system) to the nearest mm. This is why there are some discrepancies between the sum of the monthly totals and the figure in the total column. Box 625