



Historical information
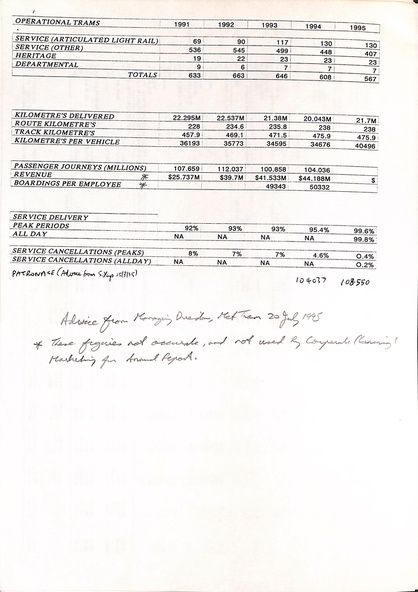
Tables of performance of the Public Transport system for the period 1991 to 1995 listing number of trams, kilometres delivered, passenger journeys, revenue, boarding per employee, service delivery, and cancellations. Notes that the revenue and boardings per employee were not accurate.
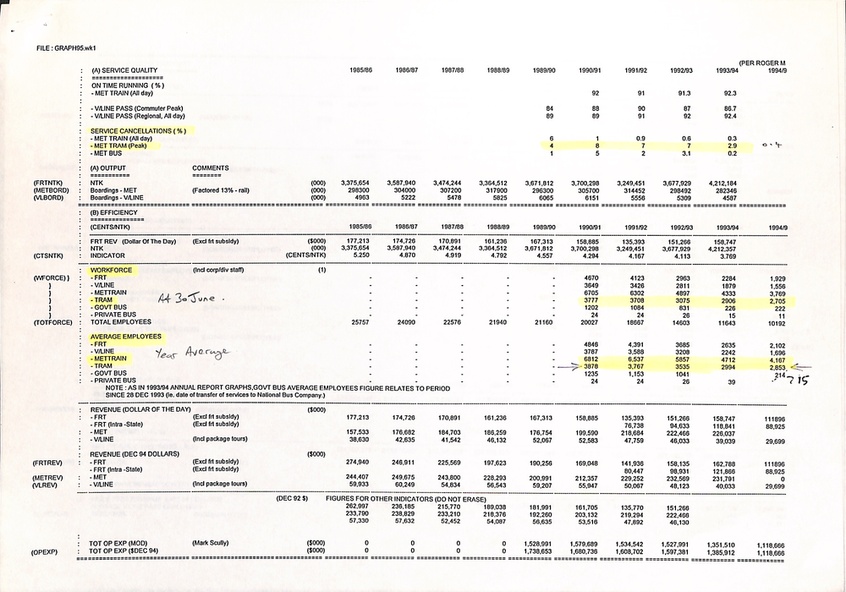
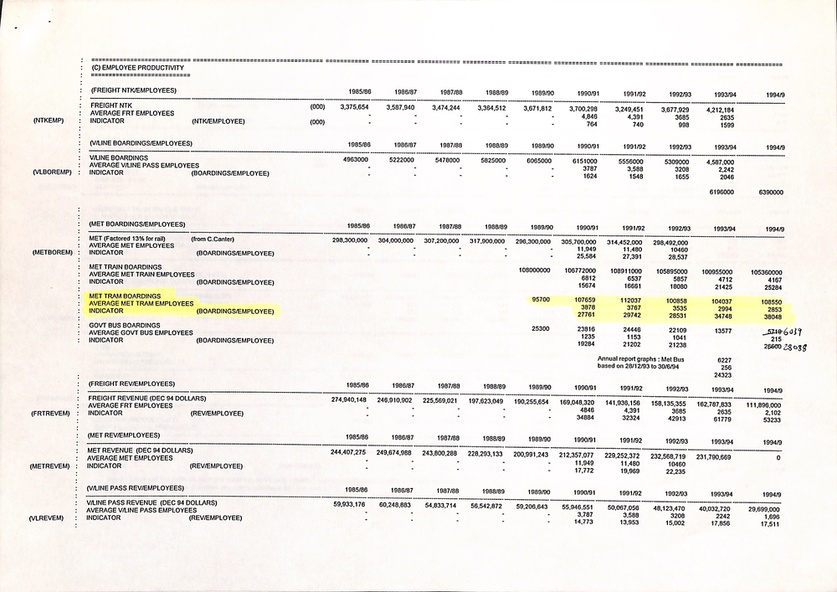
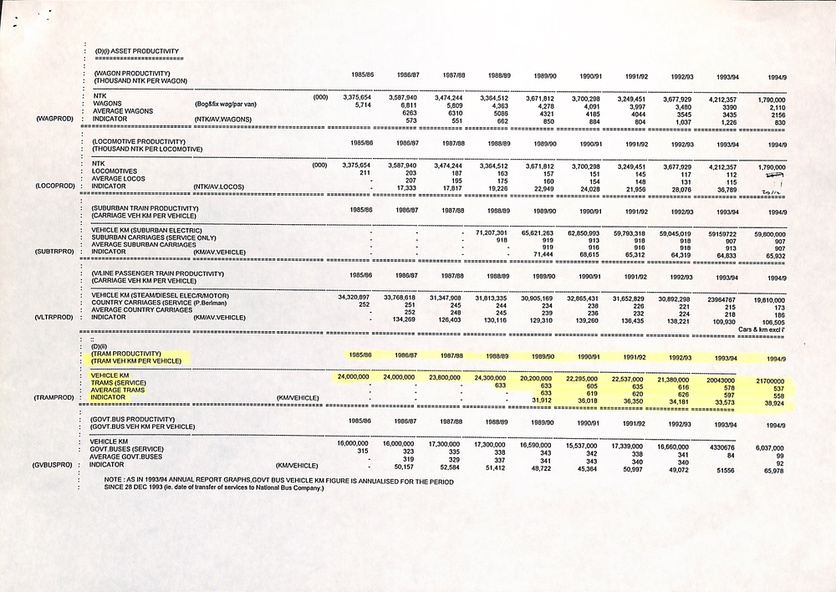
Pages 2 to 4 give data for the whole public transport system, including freight. Includes data on service quality, workforce, revenue, employee productivity, vehicle productivity including buses and vehicle km. Has data for the years 1985 to 1995.
Significance
Yields information the Melbourne tram system and demonstrates the type of information retained about the tramway system.
Physical description
Set of four A4 sheets printed and marked up.
Inscriptions & markings
On page one has a note that the figures were not accurate.
